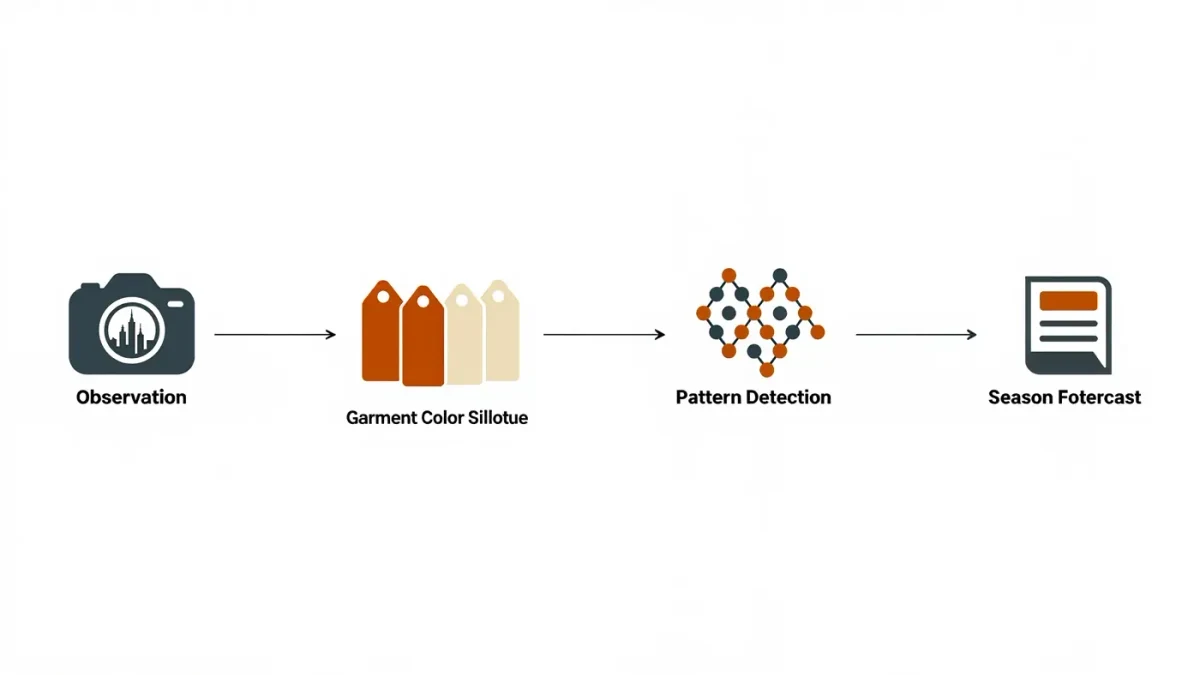
Forecasters track street style because it is the only dataset that shows what people actually wear — not what designers propose, not what magazines select, but what walks out the door and survives contact with weather, work, and self-consciousness. Agencies such as Trendstop and WGSN treat street-level observation as a standing input to their reports, and the practice long predates the platforms: photographer Bill Cunningham began documenting what New Yorkers wore for The New York Times in the late 1970s, decades before the evidence became computable, and his premise was the profession's — the street votes earlier than the runway.
The logic is chronological. Runway collections are locked a season or more before delivery; street behavior is live. When the two agree, a trend has confirmation. When they diverge, the street is usually the earlier signal of where taste is drifting next.
What does street style prove that runways cannot?
Wearability and adoption. A runway look answers what a designer imagines; it cannot answer whether a garment functions on a commute, in an office, at a price people pay. Street observation captures styling as practiced — how a proposed silhouette is actually combined, which colors repeat across unrelated wearers, how workwear migrates into evenings. Forecasters read those repetitions the way linguists read usage: a single person wearing something is a choice, a hundred unrelated people wearing it is a pattern, and patterns are what forecasts are made of.
Geography matters as much as volume. Certain cities behave as early indicators — Seoul, London, Lagos, Berlin each broadcast subcultural movements that later appear in global product — and analysts weight their observation accordingly, watching export cities for what import markets will wear in a year or two. The weighting is itself a forecast: it claims that style still flows outward from identifiable centers, a claim the platforms have complicated without quite extinguishing.
What do analysts actually record on the street?
More than outfits. A disciplined observation log captures garment category, color, fabric weight, styling choices, footwear, accessories, and carry — plus the context that gives them meaning: neighborhood, time, weather, apparent age group. Repetition across that context is the analytically valuable part. The same chunky loafer on unrelated wearers in two cities is information; the same loafer on five friends who share a wardrobe is not. Analysts also log absences, which are slower but often more telling — a silhouette vanishing from commercial streets registers as a signal long before markdowns do.
Over a season, the logs turn into frequency tables: which colors are gaining share, which hemlines are stabilizing, which accessories are crossing from one subculture into general circulation. Those tables are the raw material that feeds the clustering and confidence judgments in published reports.
Related stories: How Retail Buyers Turn Forecast Reports Into Real Orders · Who Invented Trend Forecasting, and When It Really Began.
How is street observation collected now?
In two layers. The traditional layer is human: photographers at show venues, market editors noting repetitions, agency scouts in nightlife districts and shopping streets. The newer layer is computational: platforms, search behavior, and resale listings provide machine-readable traces of what is being worn, sought, and re-sold at scale, and agencies increasingly fuse the two — using digital signals to find candidates and human observation to verify them in physical space. The result is a hybrid discipline that would be recognizable to the market editors of the 1980s in its questions, though hardly in its tooling.
The fusion exists because each layer fails alone. Digital traces skew toward performance and paid promotion; a photographed outfit may exist for the camera rather than for the wearer. Physical observation is credible but slow and small-sample. The verifiable signal is where both agree — an item photographed on strangers who did not dress for attention, showing up in searches and resale demand in the same quarter.
What are the method's known failure modes?
Three, and forecasters manage them openly. Venue bias: the crowd outside fashion-week venues now dresses for photographers, so analysts increasingly work away from the shows, in ordinary commercial streets where nobody is performing. Survivorship: what gets photographed skews young, thin, and wealthy unless sampling is corrected. And speed: by the time a street look is recognizable enough to photograph systematically, part of its early value has already leaked. Each failure mode pushes the same correction — earlier cities, quieter streets, smaller signals.
There is also a feedback problem unique to the era. When a forecast names a street trend, brands produce it, wearers photograph it, and the street fills with the forecast's own output. Distinguishing organic adoption from forecast echo is the field's current methodological frontier, and honest practitioners acknowledge it, adjusting their sampling windows backward — toward the smaller, stranger signals a forecast can still call its own.
Why not rely on sales data instead?
Sales data is authoritative but late: it describes what won, after the winning, when the next order window may already be closed. Street style is speculative but early: it shows preferences forming before they consolidate into purchases. The forecasting trade exists in the gap between those two kinds of knowledge, which is why the person with a camera on a ordinary corner — Cunningham's heirs, professional and amateur — remains part of the industry's evidence base, however much of the pipeline has moved onto screens. The tools have been upgraded every decade since Cunningham parked his bicycle; the evidence, in the end, is still other people's clothes, worn for their own reasons and read carefully by professionals.